
The Web3 Pulse 2022: What is the data saying about crypto adoption?
A comprehensive data report exploring the numbers in the web3 market.


The crypto landscape is constantly changing.
But what is the data saying about the state of crypto in 2022?
We looked at the big narratives, trends, and adoption metrics in the world of web3 and prepared a report 🧵 👇
This report isn't an in-depth analysis, but rather a pulse check on what the data is saying about the market & adoption.
We covered:
Layer 1s
Bitcoin
Ethereum
Layer 2s
DeFi (Lending, DEX, etc)
Security
Interoperability
Infrastructure
NFTs
Regulation
Below is a snippet of the data report, but we recommend viewing the complete report here.
Huge shoutout to @0x_ridam who created much of this report.
Overview

According to DappRadar, weekly active users in crypto have fallen by nearly 80% in the last 12 months.
Total Weekly Active Crypto Users = 2.8M

Weekly transaction counts are actually 8% higher now than in September 2021.
Total # of Weekly Transactions = 186M
But total weekly volumes are down 87% since last year.
Total Weekly Volume in $ = $2.7B
Gaming is the most dominant sector in terms of active users and weekly transaction count.
In terms of $ volume, DeFi activity is by far the highest.

Layer 1s
The big picture highlights:
ETH is still very much the dominant L1 when it comes to TVL, Volume, Market Cap, and Adoption.
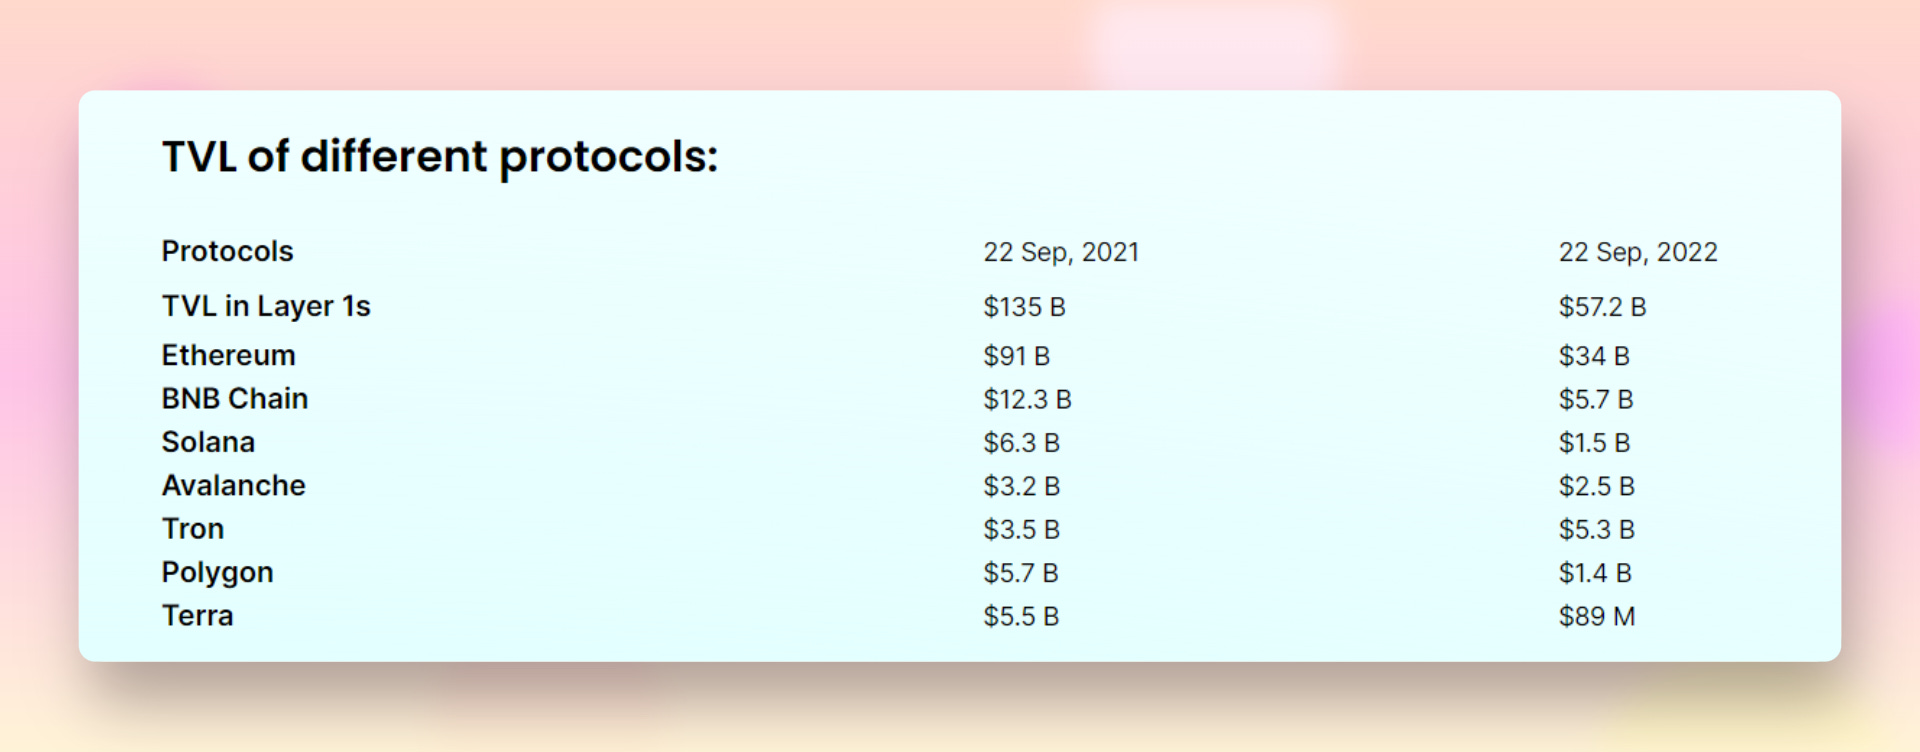
TVL across all L1s has dropped nearly 60% in the last 12 months.
NEAR has seen significant growth and adoption in the last 12 months.
Polygon has more than doubled its active users since October 2021.
Active addresses and daily tx count for some large L1 chains (Solana, BSC, Avalanche) are relatively unchanged in the last 12 months.
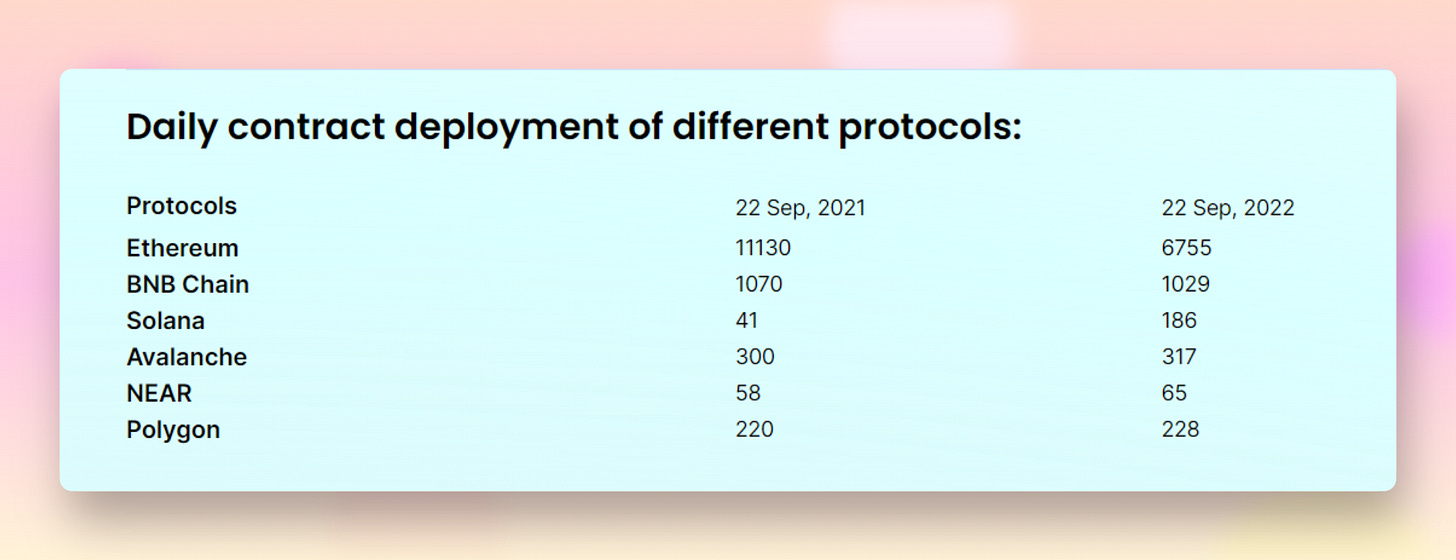
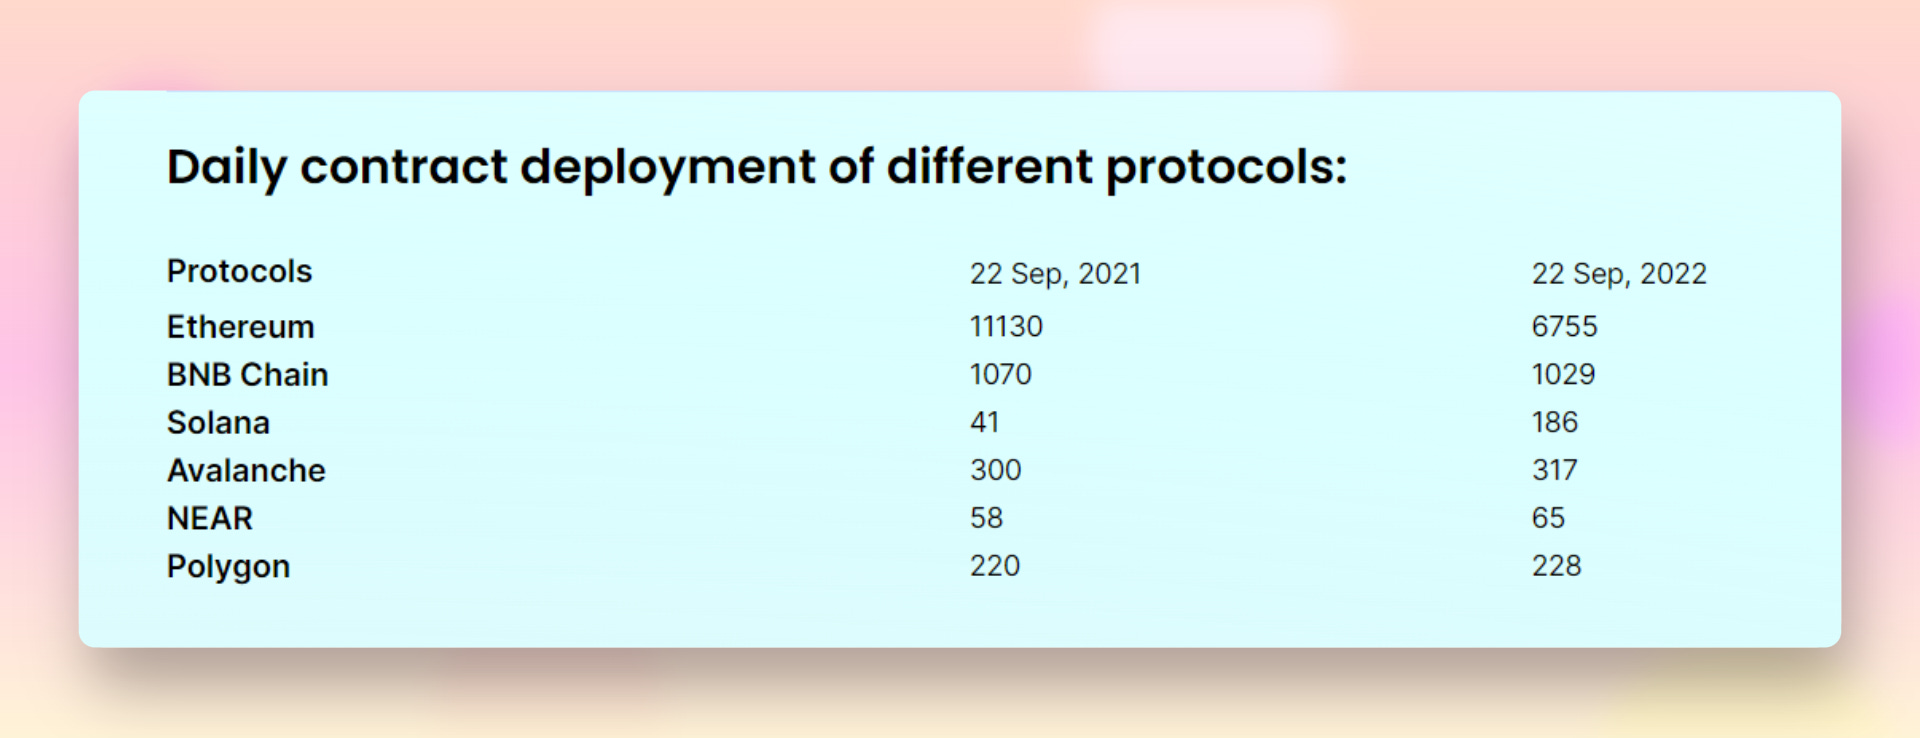
There are around ~1 million weekly downloads for the ethers npm package, showing that developer activity is still strong - only Ethereum has seen a decline in daily contract deployment numbers.
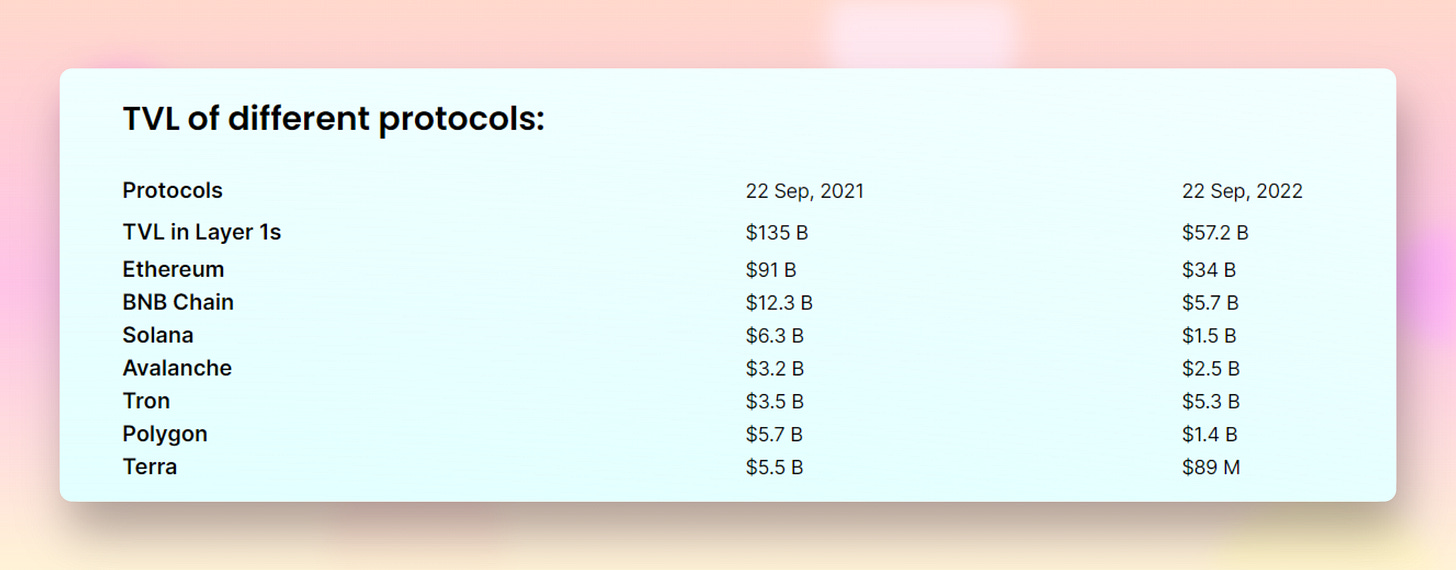
TVL across all L1s has dropped nearly 60% in the last 12 months
Ethereum: -62%
BNB Chain: -47%
Solana: -76%
Avalanche: -22%
Tron: +50%
Polygon: -75%
Terra: -98%
Shoutout to our awesome sponsors for powering this report.
Radiant is building the first omnichain money market atop of LayerZero. Deposit & borrow across multiple chains, seamlessly.
Brew Money enables people to earn yield on their crypto tokens with self-custody through blue chip DeFi protocols on mobile.
Treehouse Finance is helping everyday investors and institutions confidently navigate DeFi.
Ethereum
As we mentioned in the L1 updates, Ethereum is still very much the dominant blockchain. Here are the TLDR stats for the Ethereum network:
205M unique addresses
450k weekly active addresses
20% ETH dominance
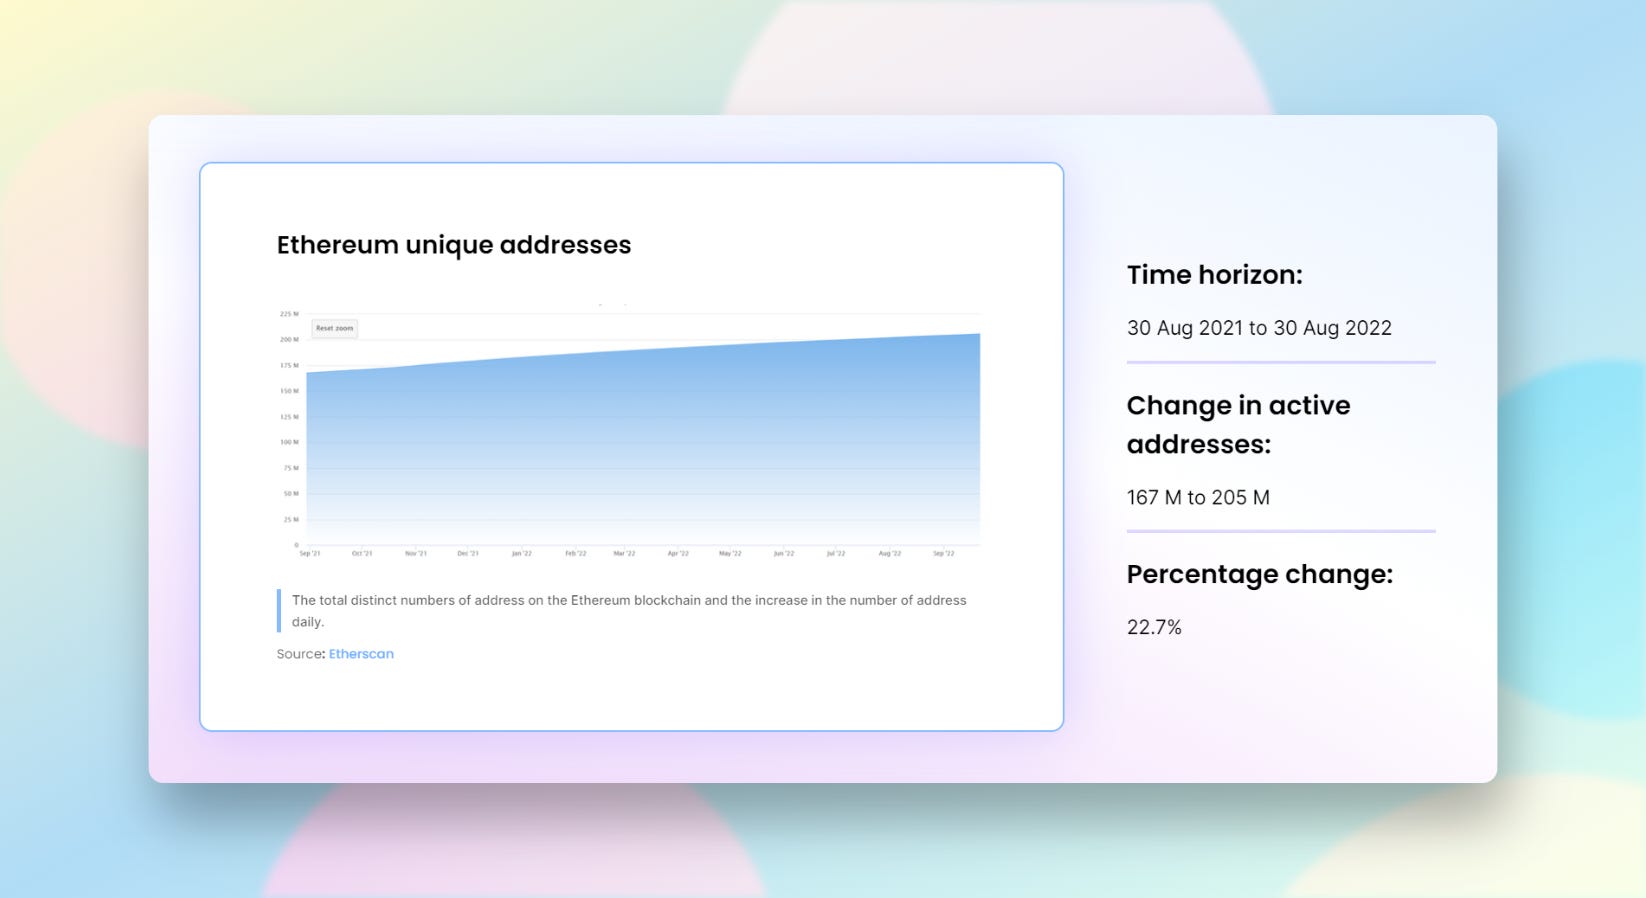
The ETH network has settled $2.5T on-chain in the last 12 months. In 2021, the network settled $11.6T in volume (bear market vs bull market)
Onchain volume on Ethereum for September 2022 was $129B (-53% since Sep 2021).


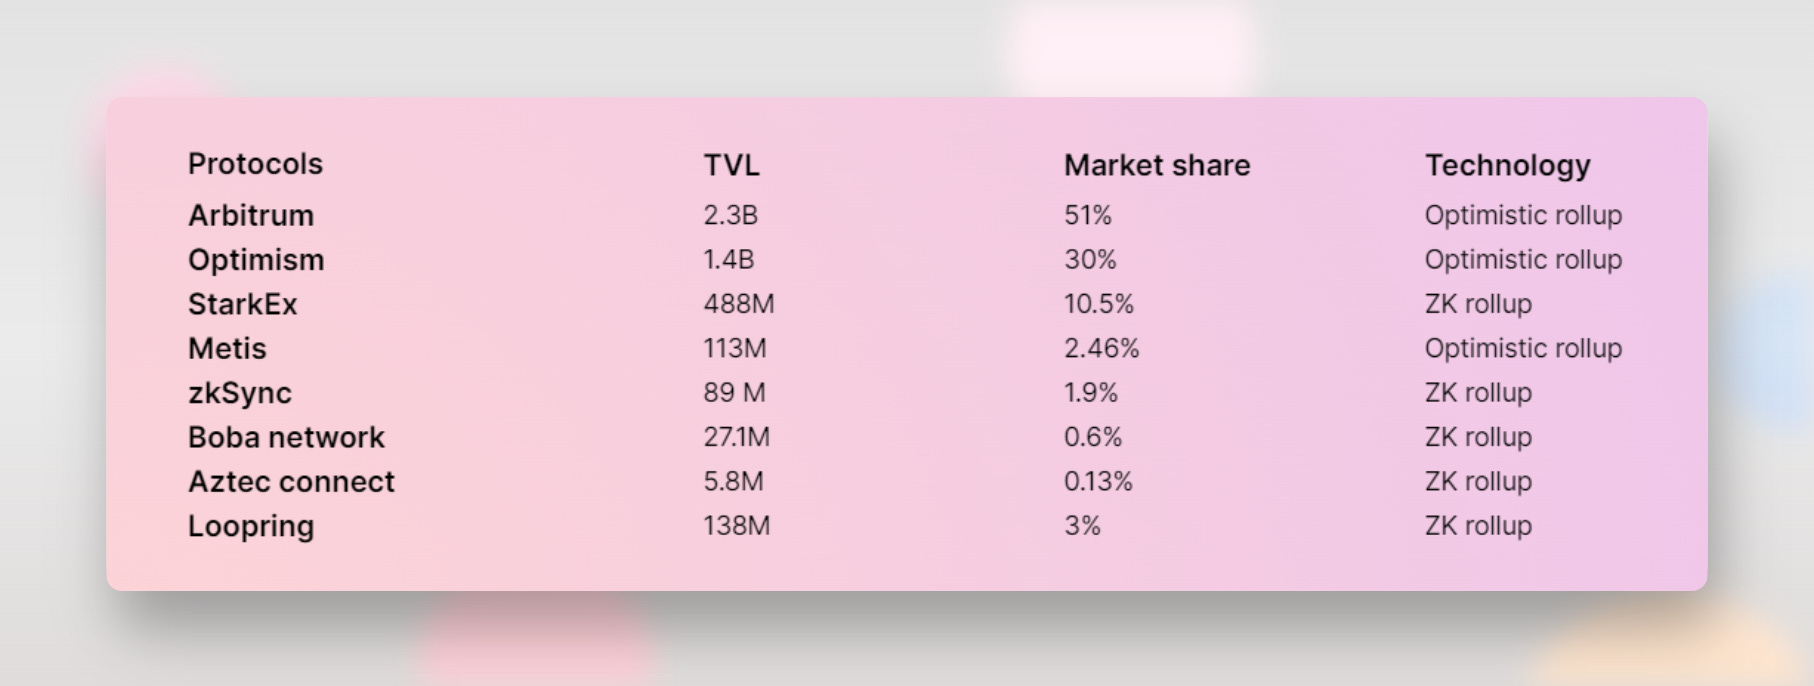
Layer 2s
At this point, it seems clear that rollups will be the winning L2 solution and now it’s just a matter of seeing which ones dominate the market.
• When it comes to Layer 2s, Optimism and Arbitrum are by far the dominant blockchains. Combined they have over 80% of the total market share by TVL.
• StarkEx is third with 10%.
Here’s a video we made previously explaining Optimistic vs Zk-rollups.
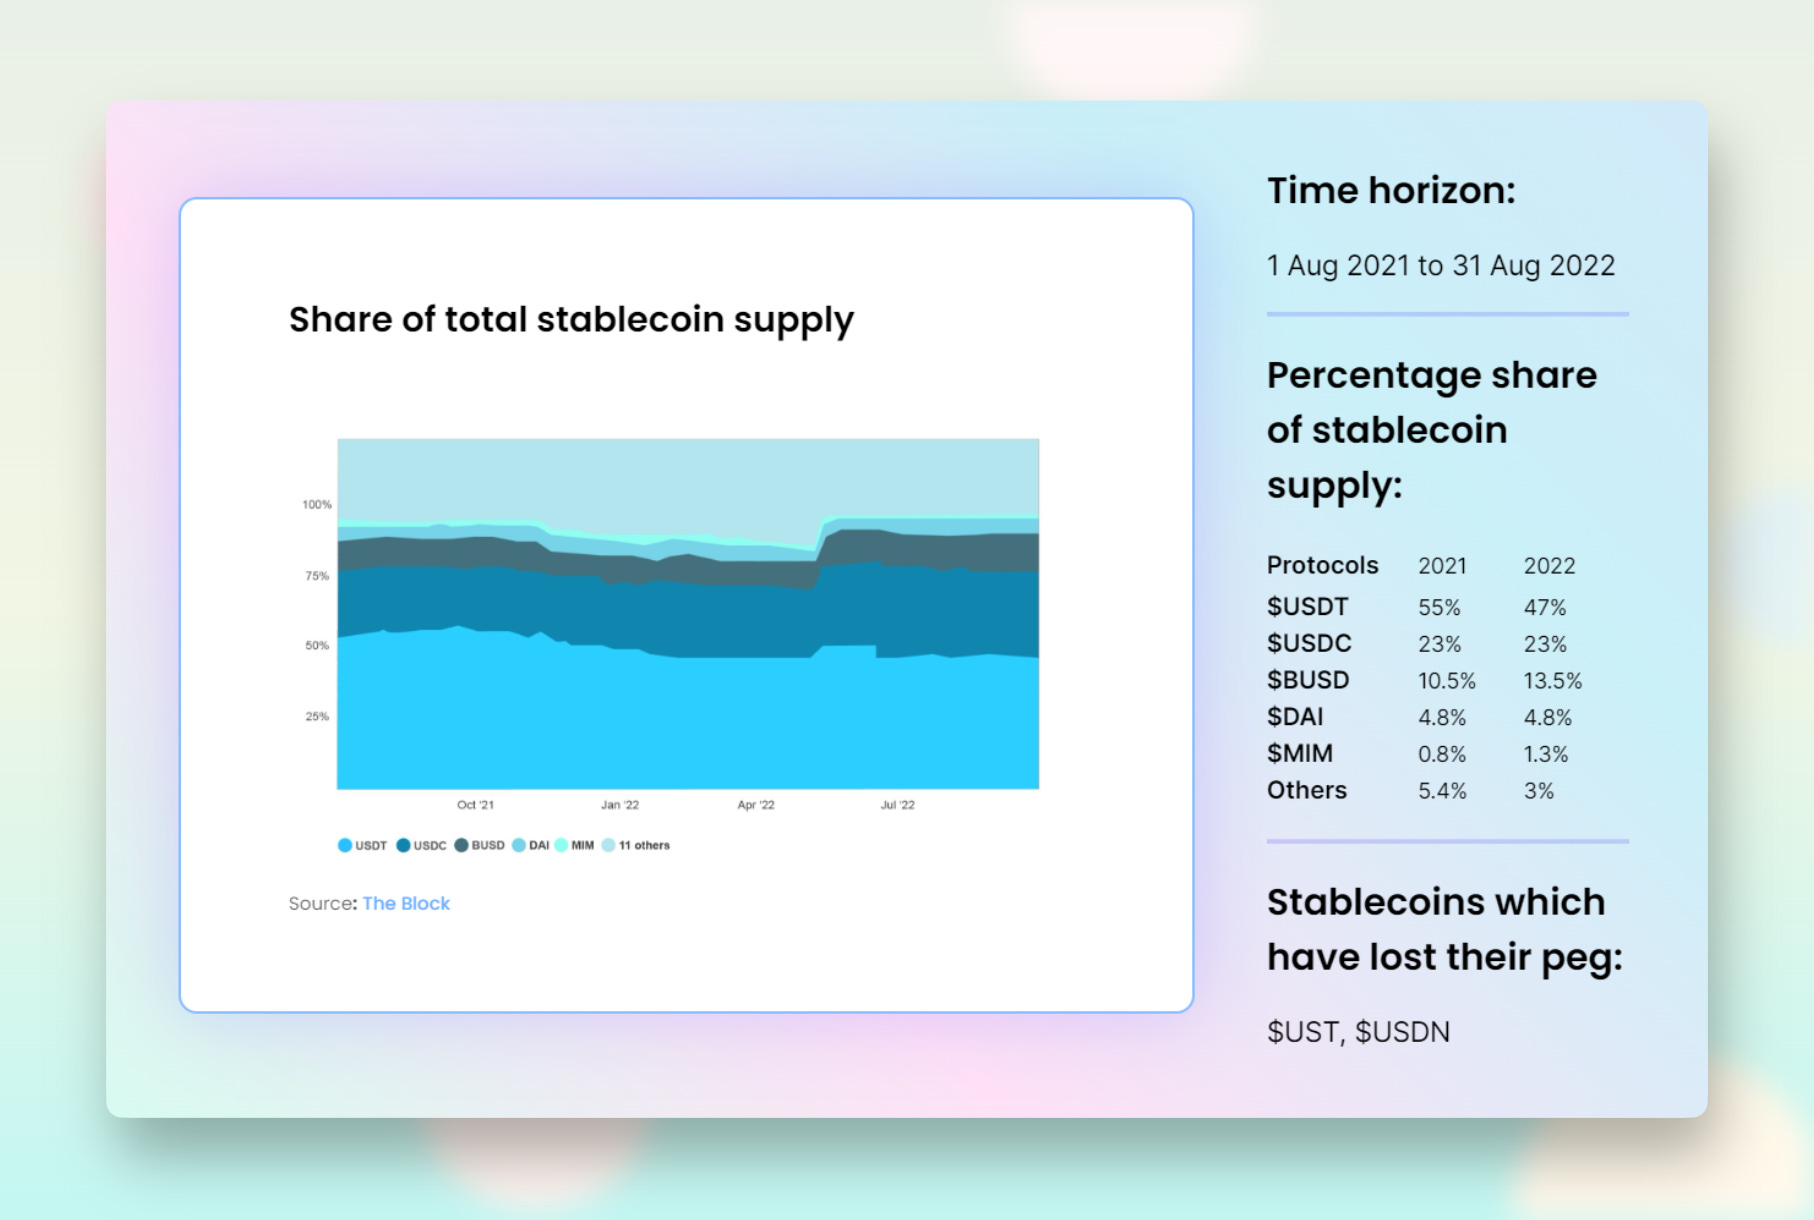
Stablecoins
Stablecoins are among the first instances of tokenized real-world assets on-chain and are currently one of the most important utilities of Crypto.
Total stablecoin supply has increased ~22% since August 2021.
The top 3 stablecoins (USDT, USDC, and BUSD) control a combined 83.5% share by market cap.
DAI is the largest decentralized stablecoin with a market share of ~5%.
DeFi
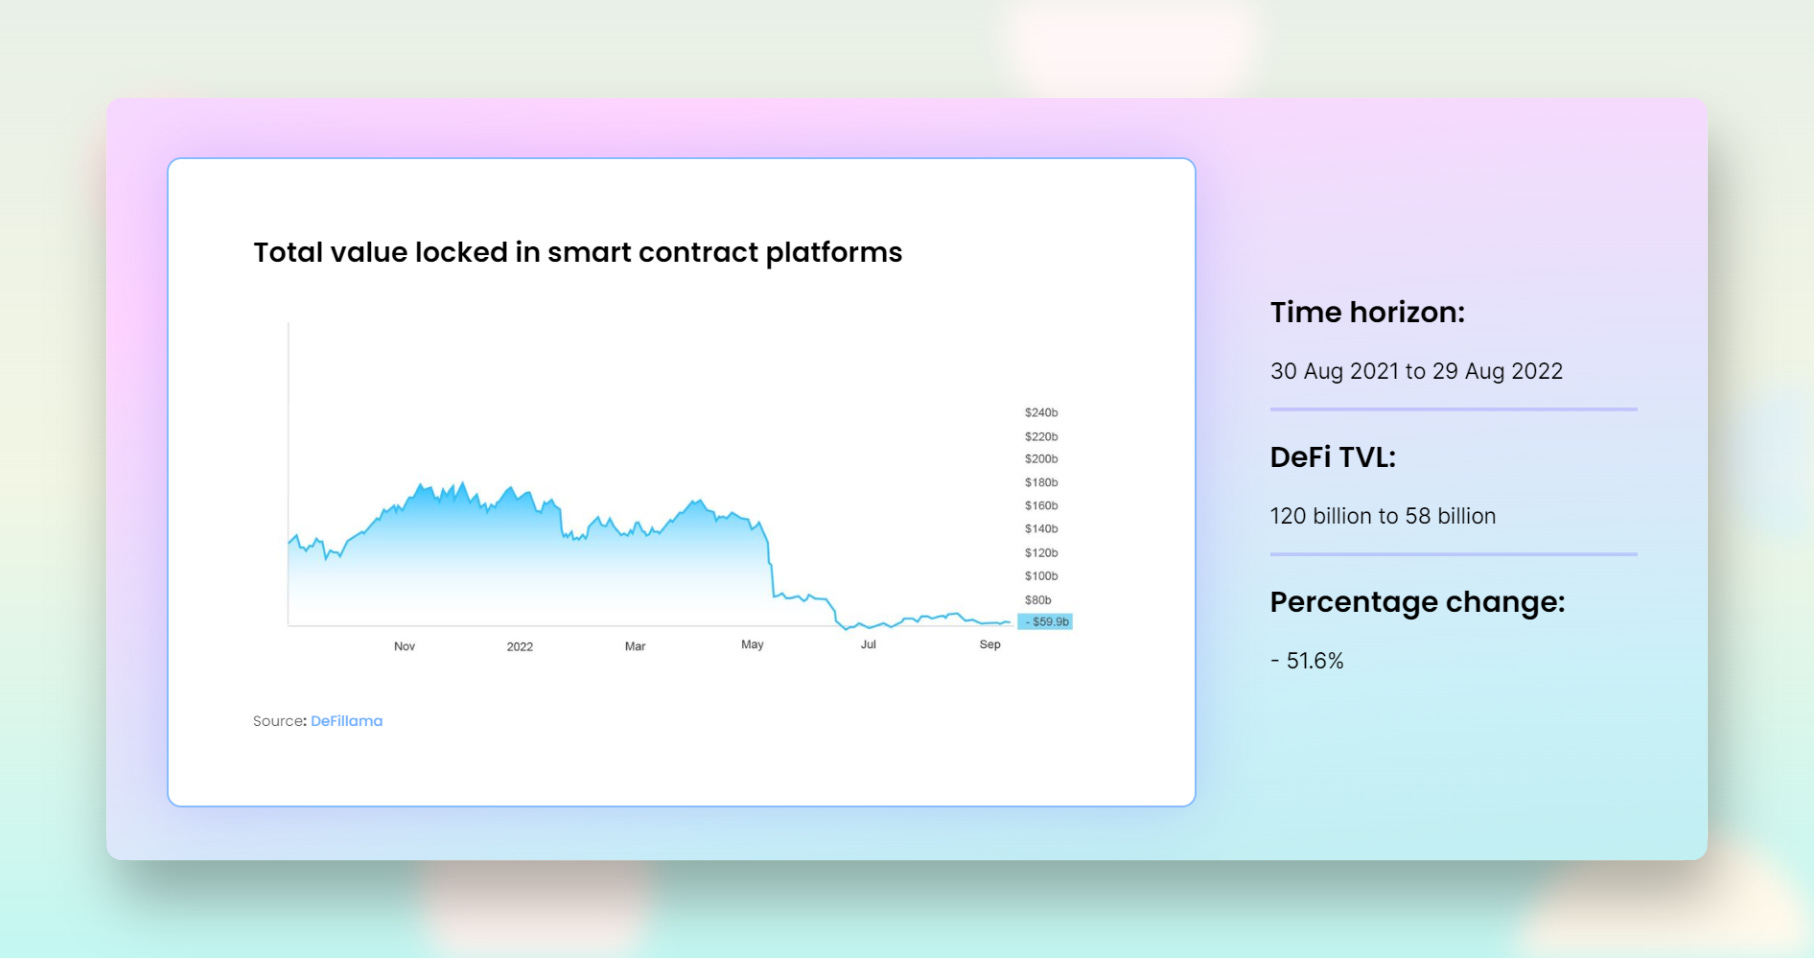
In 2021, the TVL of the DeFi market grew to ~$180 billion, but much of this TVL was built on top of leverage and unsustainable inflationary rewards in a bull market.
TVL has now dropped to $55 billion.
The number of weekly active addresses in DeFi has gone from 2.3% to 1%. (-58%)
DeFi weekly volume has gone from $13B to $1.6B according to DappRadar.
Lending/Borrowing
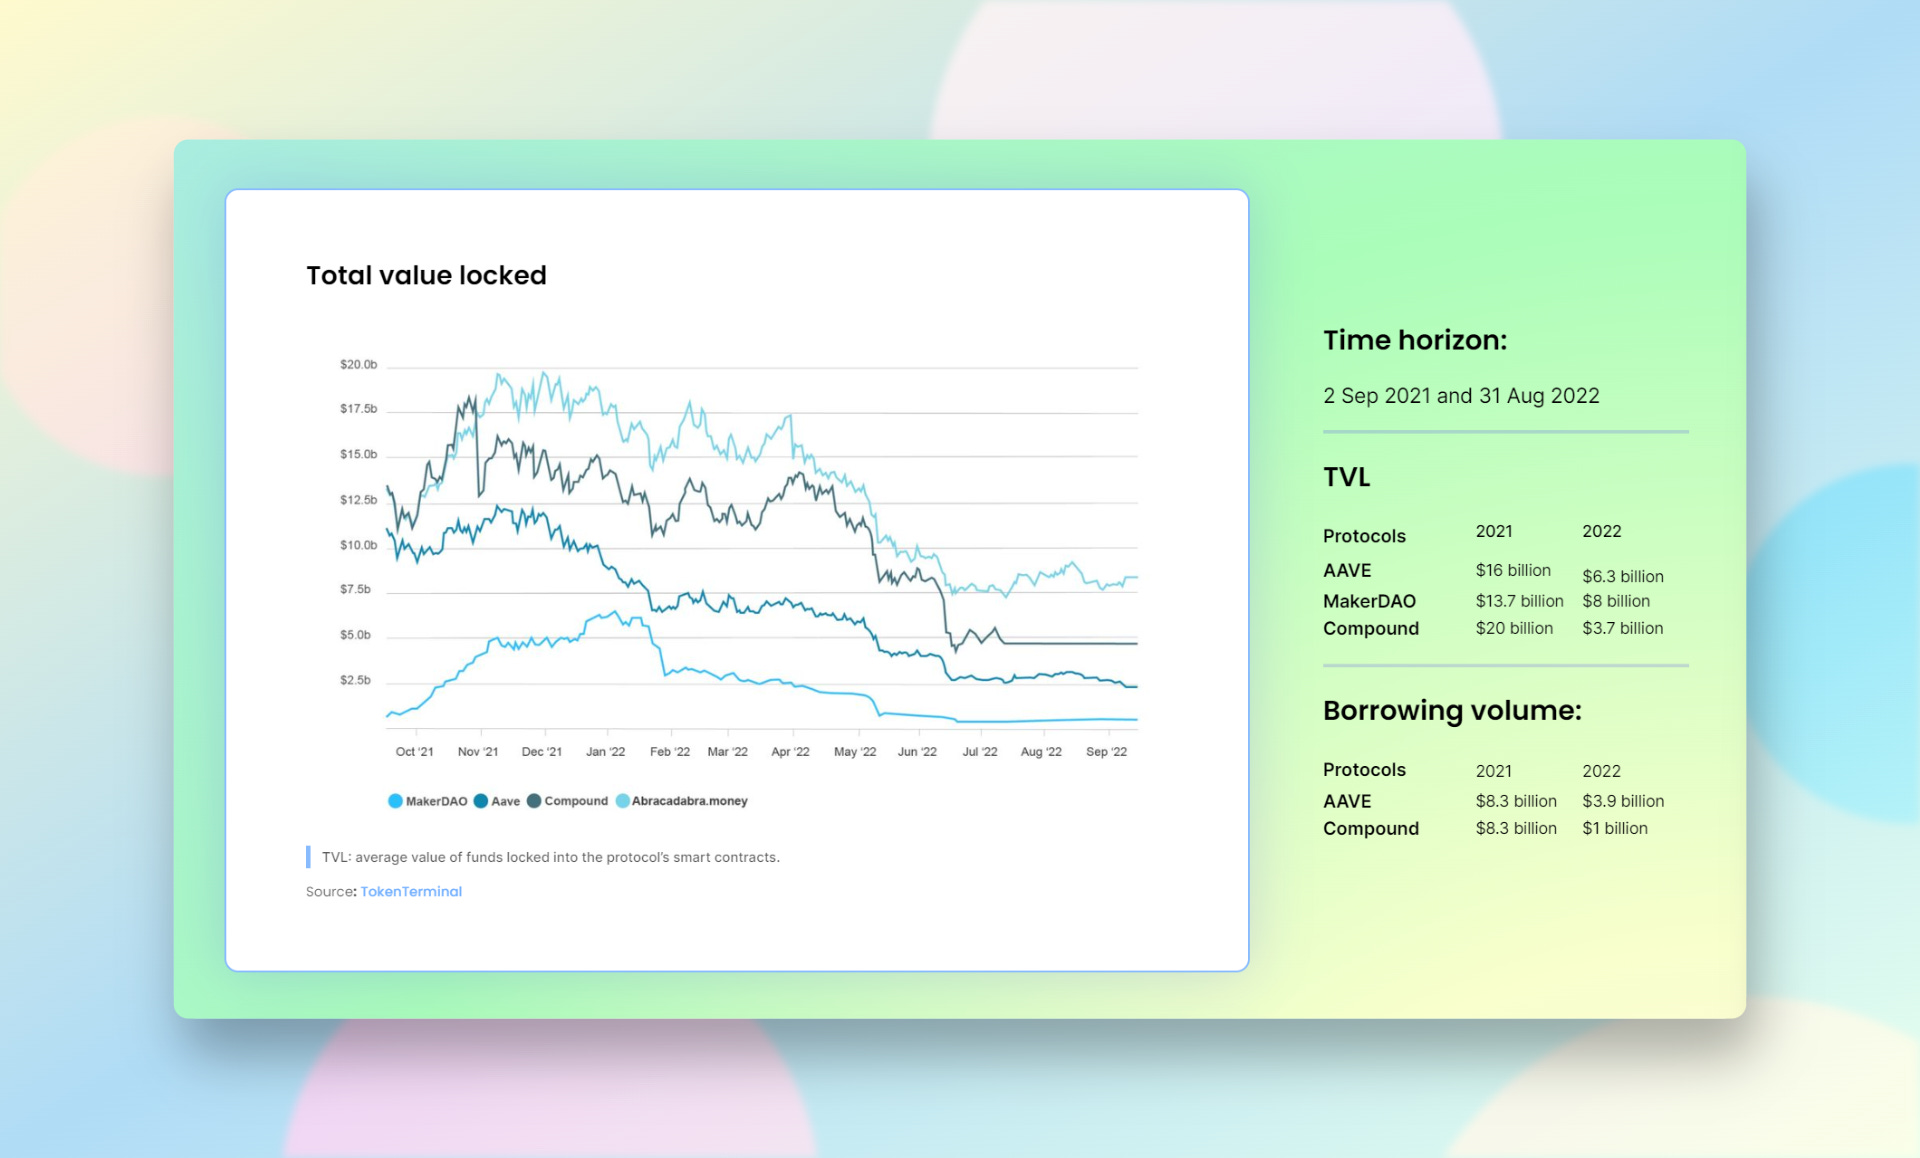
The TVL in the DeFi lending market also saw tremendous growth in 2021.
At their peak, protocols like AAVE and MakerDAO had more than $15 billion of value locked, with Compound and others not far behind.
Revenue:
In the last 12 months, AAVE has made $31.5M, Maker has made $72M in protocol revenue, and Compound has made $18.7M.
But the lending revenue has gone down significantly since the end of 2021. AAVE token holders were making $6M+ in monthly revenue in October 2021. Now, only $1.5M per month. (-75%)
But borrowing volume has fallen significantly since the end of 2021.
For AAVE, it has gone from $8.3 billion to $3.9 billion.
For Compound, it has gone from $8.3 billion to $1 billion.
Lending revenue has also decreased consequently:
AAVE token holders were making $6M+ in monthly revenue in October 2021. Now, only $1.5M per month. (-75%)
In the last 12 months, AAVE has made $31.5M, Maker has made $72M in protocol revenue, and Compound has made $18.7M.
But while the TVL for OG DeFi protocols like Aave have fallen, RWA-based lending platform GoldFinch has seen great growth – its TVL has grown more than 3-fold.
DEXs
In the last 12 months, DEXes have done a combined spot volume of more than $1.5 Trillion.
The ratio of DEX/CEX spot volume hasn’t changed much in this period.
In 2021, 90% of DEXes were using Automated Market Makers but now only around 81% are using AMMs, with the rest using order books or hybrid models.
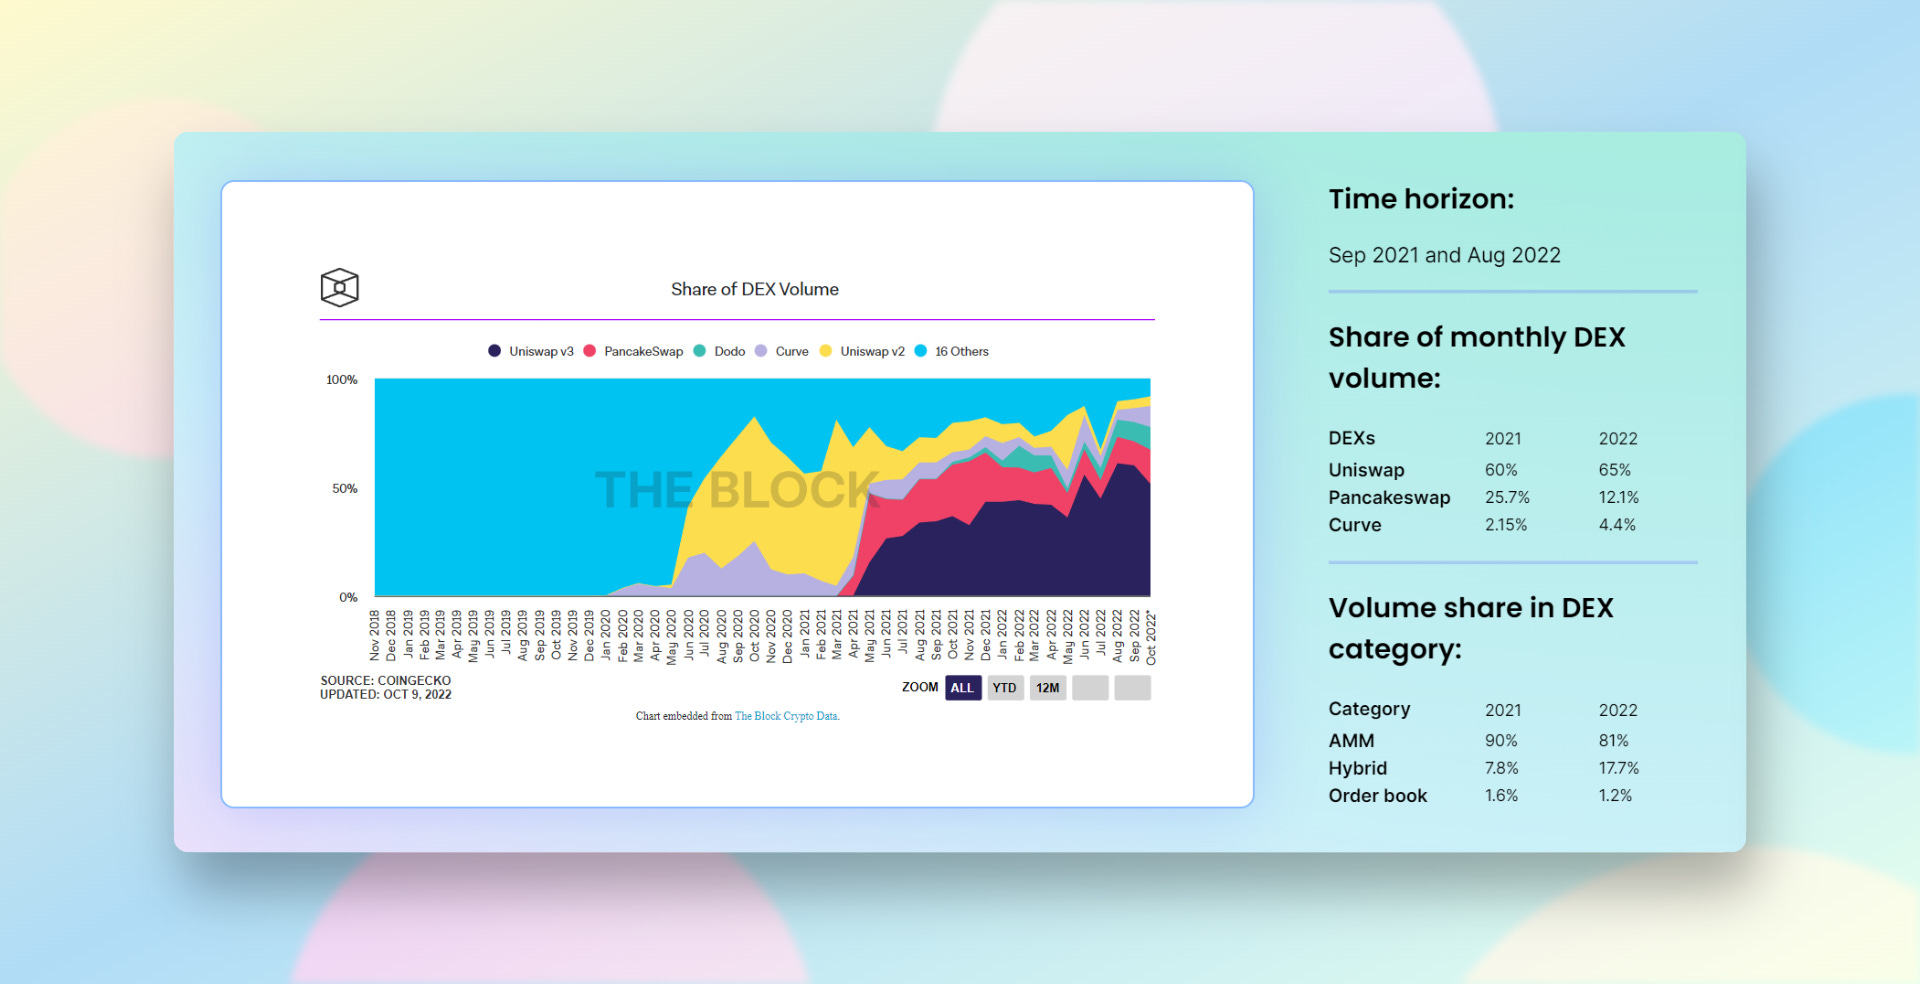
• Uniswap has maintained a dominant market share in the DEX market by monthly volume (65%). Curve owns around 5% of the monthly volume due to its superior stable swap.
NFTs
After seeing a period of astonishing growth between 2021 and 22, reality has caught up to the NFT market as well.
The daily number of sales and sales volumes in USD have declined substantially in the last 12 months:
i. Daily sales went from 151k → 26k (-82%)
ii. USD sales volume went from $76M → $14M (-81%)
iii. Weekly NFT trading volume has gone from $545M → $121M (-78%)
According to NFTGo, the total NFT market cap has increased nearly 5x from $4.6 billion last September to $22.5 billion now, even hitting $35 billion at its peak in early 2022.
The majority of this market cap has been majorly concentrated between 5 categories, and these 5 categories represent a total of 94.8%.
PFP >>>> Collectibles >> Gaming > Art > Land.

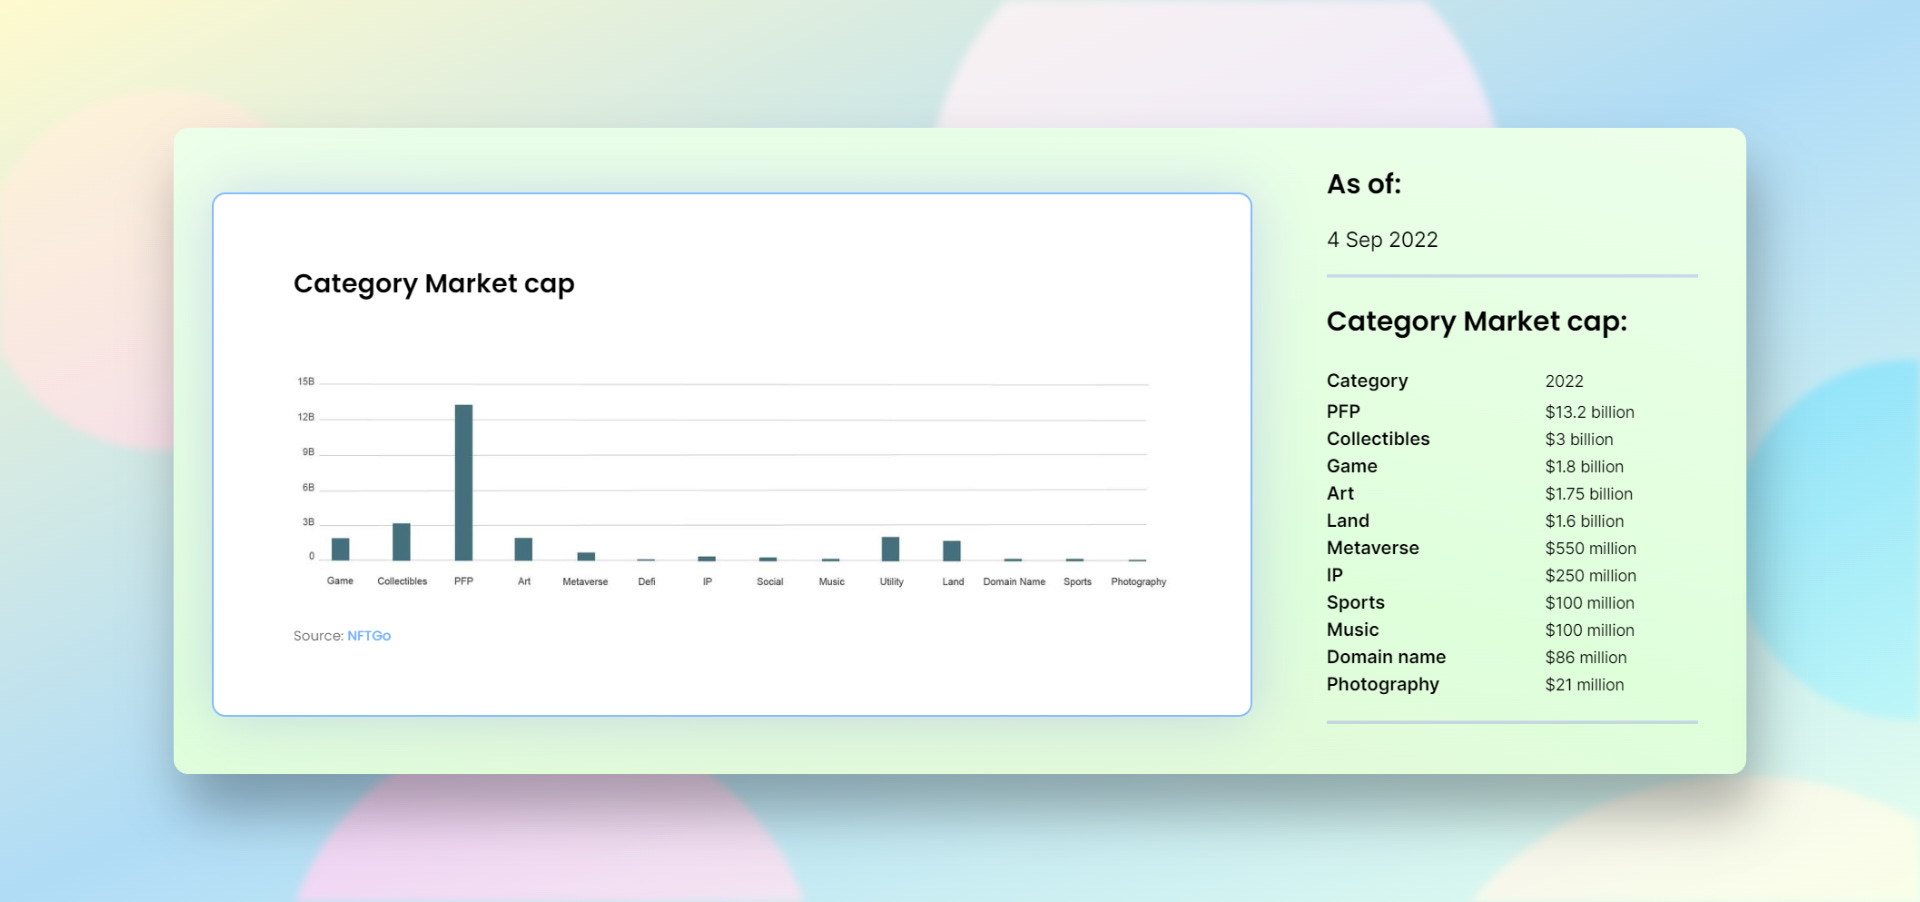
Out of this $22.5 billion:
$13.2B PFPs
$3B Collectibles
$1.8B Game Assets
$1.75B Art
$1.6B Land
$550M Metaverse
$250M IP
$100M Sports
$100M Music
$86M Domains
If you enjoyed this snippet, then you’ll love reading the complete report on our website: https://www.leapfrogcrypto.com/the-web3-pulse-check